


Contents

Here at 6clicks, risk management has been one of our primary focuses for 2022, with some fantastic new and improved risk functionality released to date. And we’re just getting started!
Today we’re excited to announce the release of our new and improved metrics capability. The metrics module allows you to measure and track essential things for your team and can be used to help drive decision-making when it comes to risk and compliance. For example, one primary use of metrics is to create key risk indicators to help better manage risk management programs.
6clicks’ new metric module allows you to derive a metric directly from 6clicks. For example, count how many risks there are in the cyber security risk domain, with a risk rating equal to very high. You can also manually create metrics to track data sources outside 6clicks.
This may sound complicated, but the product and engineering team has ensured it is not! When creating a new metric from the metric module, you can easily define the scope conditions of your metric. Using our example from above, you can see in the screenshot below we have defined a metric that records how many risks there are in the risk register with a very high-risk rating in the cyber security risk domain.
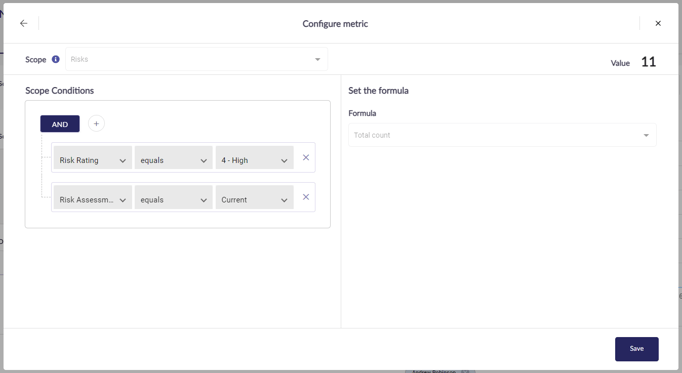
In the above example, we used total count as the formula, but you could also calculate the sum, average or percentage!
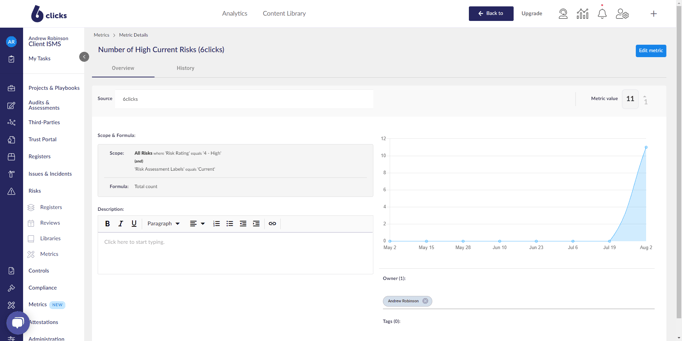
Once created, you can view the metric value in a chart format that tracks it over three months. If a risk is updated to meet the metric conditions, this will automatically reflect in the metric value and the chart. Similarly, if a risk that met the metric conditions is updated and no longer meets the conditions, then the metric value and chart will also update. This means that the metric dynamically updates in real-time. You can also assign metric owners and tags to manage your risk metrics better.
If you’re keen to learn more about this functionality, click here.

Written by Louis Strauss
Louis began his career in Berlin where he also founded Dobbel Berlin – Berlin’s curated search engine. Returning to Melbourne to join KPMG, Louis lead the development of software designed to distribute IP and create a platform for us by advisors and clients. While at KPMG, Louis also co-authored Chasing Digital: A Playbook for the New Economy. Louis is accomplished in stakeholder management, requirements gathering, product testing, refinement and project implementation. Louis also holds a Bachelor of Engineering and a Masters of Information Systems from the University of Melbourne.